 This is a triangular plot of an estimated voting outcomes in England. This style of graph is capable of pitting three different variables against each-other. This graph shows data that adds up to a number above 100%, meaning that there must be some voters who fit under multiple categories.
Sunday, April 26, 2009
Triangular Plot
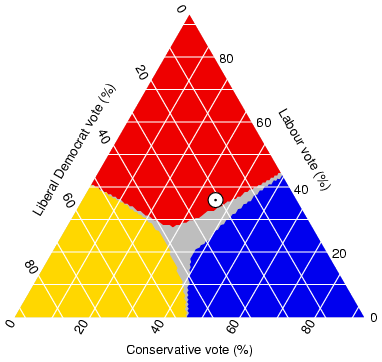
This is a triangular plot of an estimated voting outcomes in England. This style of graph is capable of pitting three different variables against each-other. This graph shows data that adds up to a number above 100%, meaning that there must be some voters who fit under multiple categories.
Subscribe to:
Post Comments (Atom)
No comments:
Post a Comment